Free report

How do Kunak AIR sensors perform against US EPA targets?

Two sensors with the same datasheet can deliver very different data in the field. This report puts Kunak AIR Pro and AIR Lite next to reference stations and scores every metric against the targets the US EPA set for air sensors.


Six pollutants, five independent test sites and up to three co-located units per test. Every table is included, so you can compare offers on evidence rather than promises.

  • 6pollutants: PM2.5, PM10, O3, NO2, CO, SO2
  • 5field sites in Spain, France, Thailand and the USA
  • 0.96R² for 24-hour PM2.5 (AIR Pro, Valencia)
  • -1 to 43 °Cambient range across all deployments
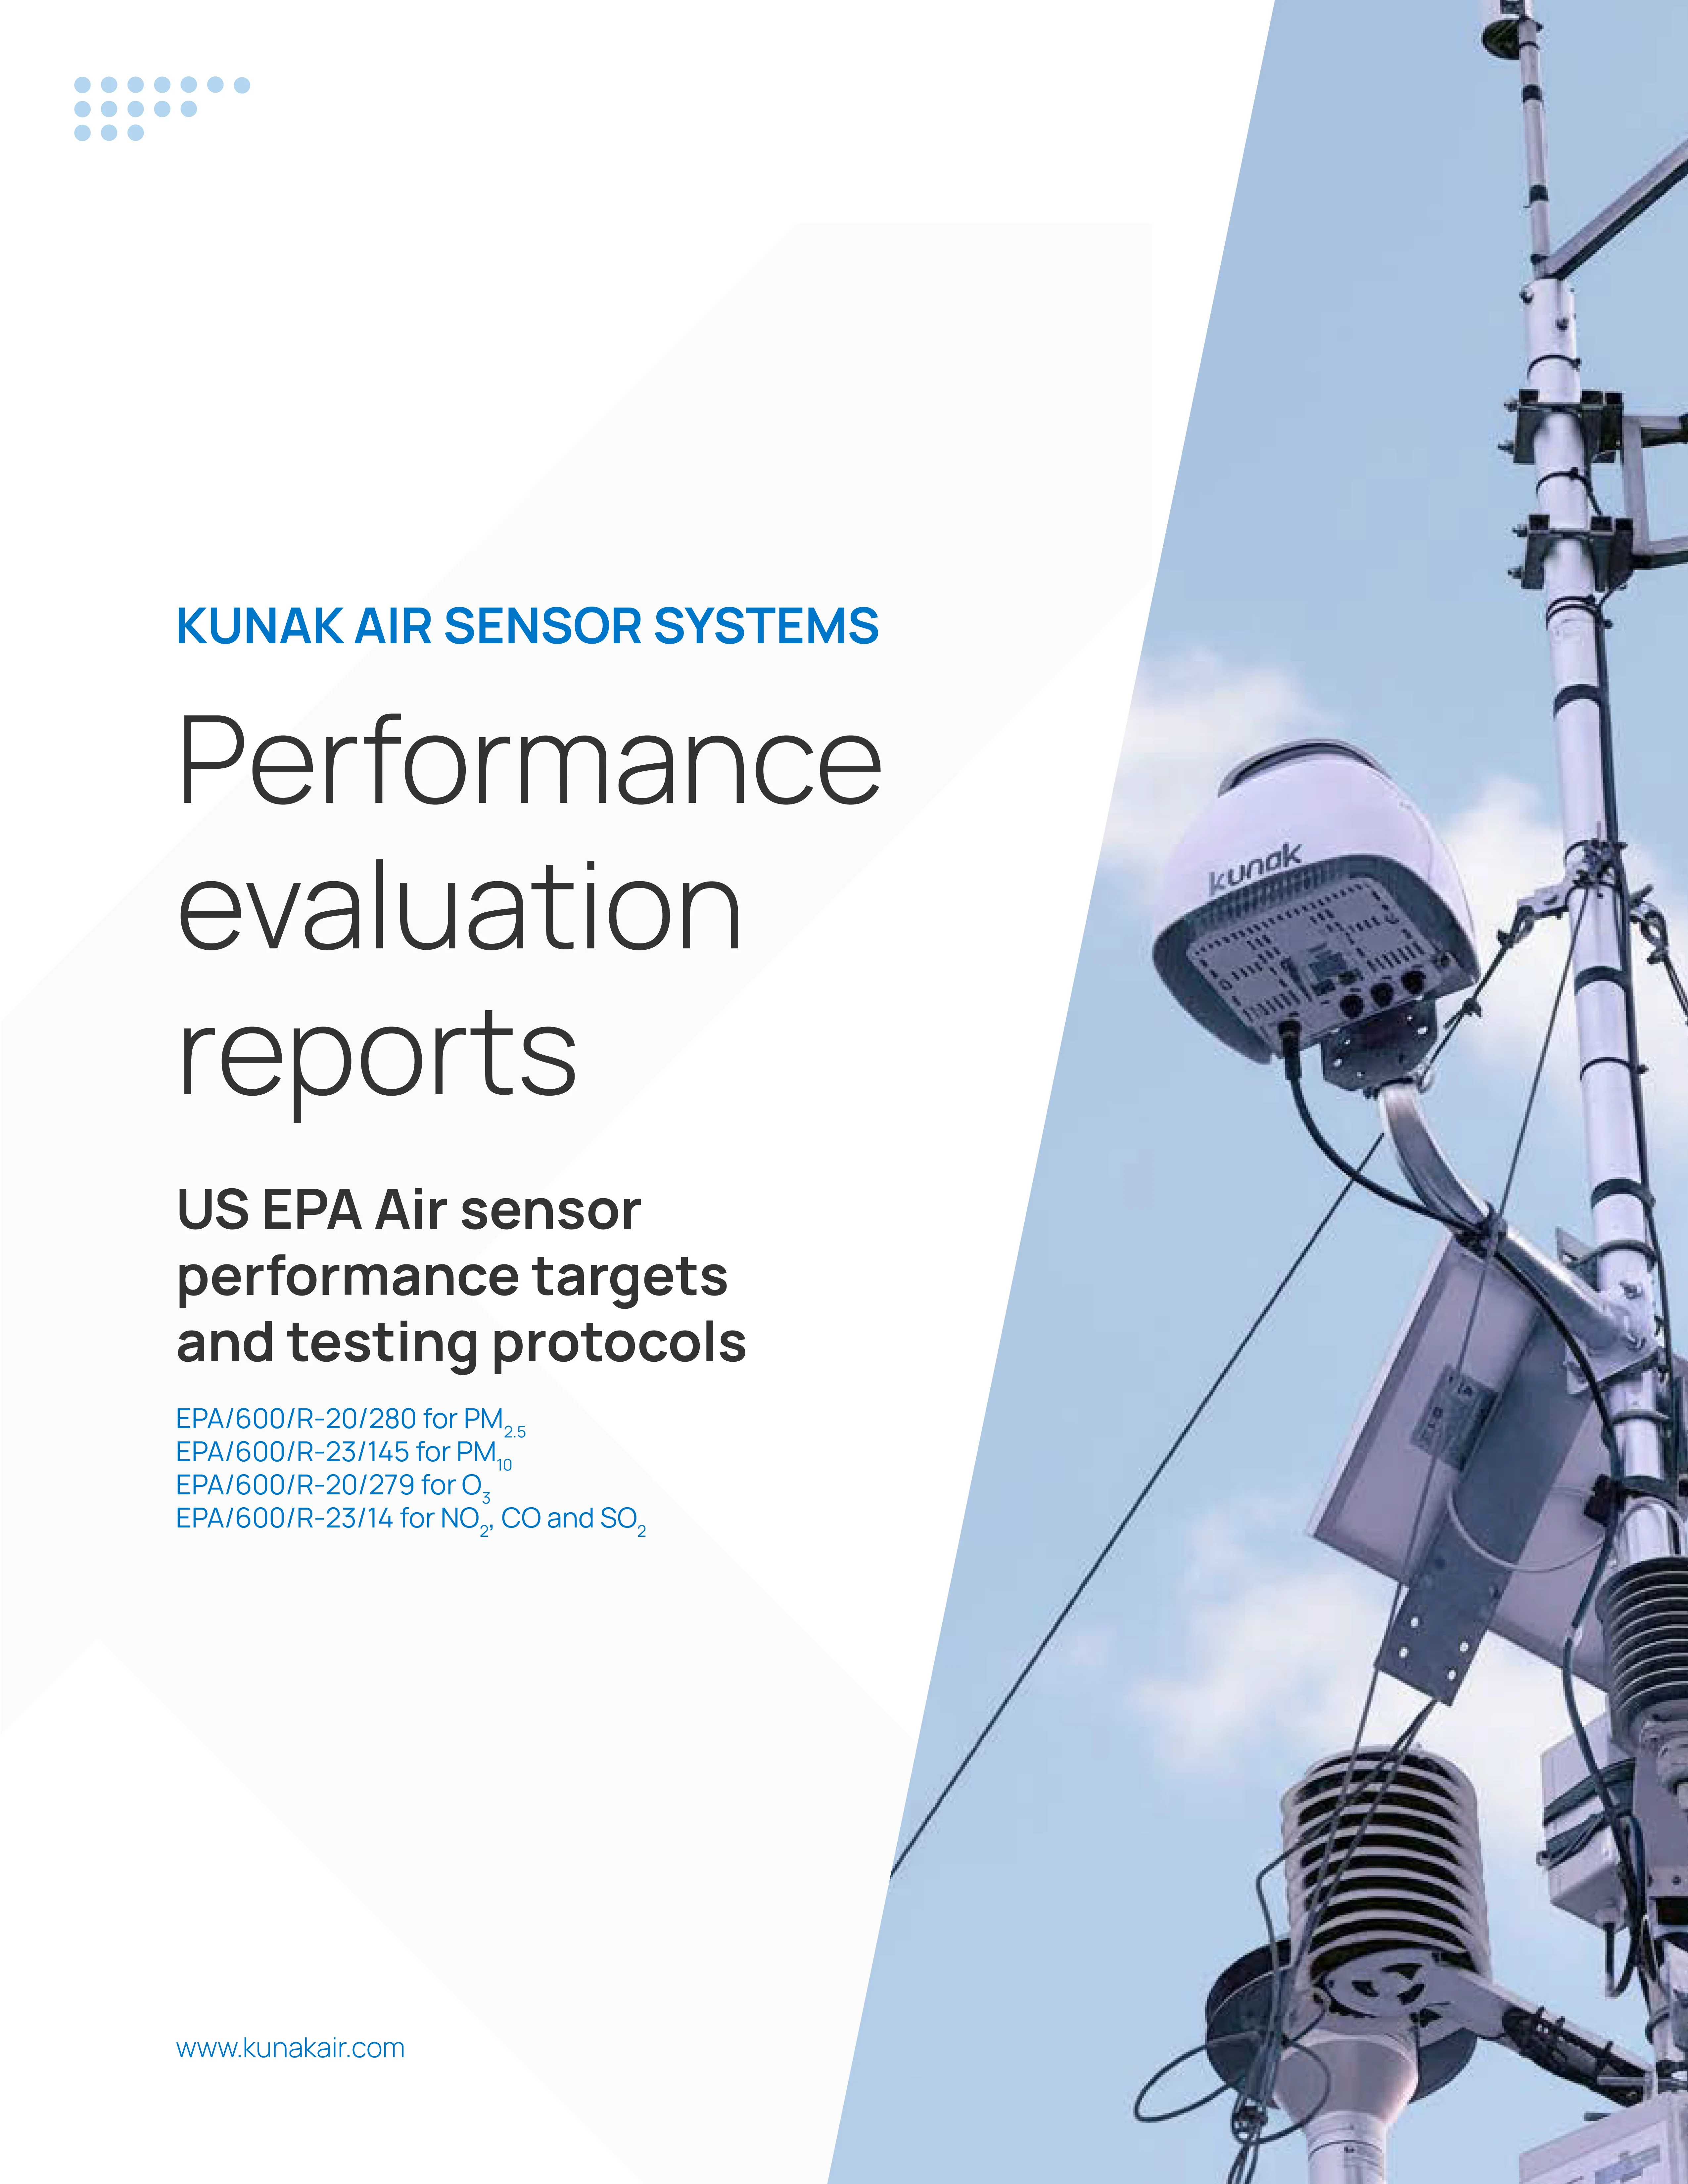
Cover of the Kunak AIR sensor systems performance evaluation reports, US EPA air sensor performance targets and testing protocols

What's inside

Seven evaluation reports, one per pollutant and model, each following the reporting template defined in the corresponding EPA protocol.

  • Accuracy against FRM/FEM monitors: R², slope, intercept, RMSE and NRMSE for 1-hour and 24-hour averages, unit by unit.
  • Sensor-to-sensor precision: coefficient of variation and standard deviation between co-located units of the same model.
  • Data quality: uptime and number of paired values behind every result.
  • Meteorological influence: temperature and humidity distributions during each deployment, and whether they biased the readings.
  • Time series and scatter plots: the raw comparison with the reference station, not only the summary statistics.
  • Test conditions: site, operator, dates, firmware version and serial numbers of every device.

Results at a glance

Mean correlation with the reference monitor for each evaluation. The full report adds every other metric and the EPA target range for each one.

PollutantModelEPA protocolTest siteR² 1-hourR² 24-hourEPA targets
PM2.5Kunak AIR ProEPA/600/R-20/280Valencia, SpainLEZ network, Dec 2023 to Jan 20240.910.96All met
PM2.5Kunak AIR LiteEPA/600/R-20/280Lille, FranceAIRLAB Challenge (Airparif), Mar to Jun 20230.870.91See note
PM10Kunak AIR ProEPA/600/R-23/145Valencia, SpainLEZ network, Dec 2023 to Jan 20240.840.90All met
O3Kunak AIR ProEPA/600/R-20/279Lille, FranceAIRLAB Challenge (Airparif), Mar to Jun 20230.93n/aAll met
NO2Kunak AIR ProEPA/600/R-23/146Bangkok, ThailandAIRLAB Challenge, Mar to Jun 2023, 25 to 43 °C0.80n/aAll met
COKunak AIR ProEPA/600/R-23/146Riverside, California, USAAQ-SPEC (South Coast AQMD), Mar to May 20240.85n/aSee note
SO2Kunak AIR ProEPA/600/R-23/146Le Havre, FranceATMO Normandie, Jun to Jul 20230.85n/aSee note

Gas protocols evaluate 1-hour averages only. Three units were co-located in every test except SO2 (two units). EPA target for R²: ≥ 0.70.

Where a result falls short, the report says so

A performance report that meets every target on every pollutant should raise questions. This one shows the exceptions and the data needed to judge them.

  • CO: the intercept (73.8 ppb) sits above the protocol range, while RMSE is 65.6 ppb against a target of ≤ 150 ppb.
  • SO2: sensor-to-sensor CV is 37 % against a target of ≤ 30 %, with a standard deviation between units below 1 ppb.
  • PM2.5, AIR Lite: one of the three units had a field issue and did not report data, so its uptime target was not met. The other metrics were.

© Kunak Technologies SL

Built with